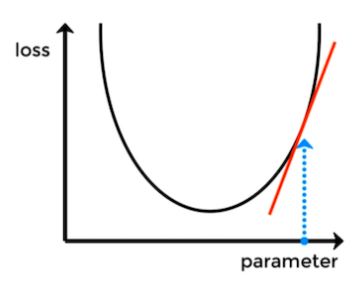
I'm looking at the loss function: mean squared error with gradient descent in machine learning. I'm building a single-neuron network (perceptron) that outputs a linear number. For example:
Input * Weight + Bias > linear activation > output.
Let's say the output is 40 while I expect the number 20. That means the loss function has to correct the weights+bias from 40 towards 20.
What I don't understand about mean squared error + gradient descent is: why is this number 40 displayed as a point on a parabola?
Does this parabola represent all possible outcomes? Why isn't it just a line? How do I know where on the parabola the point "40" is?

