1
$\begingroup$

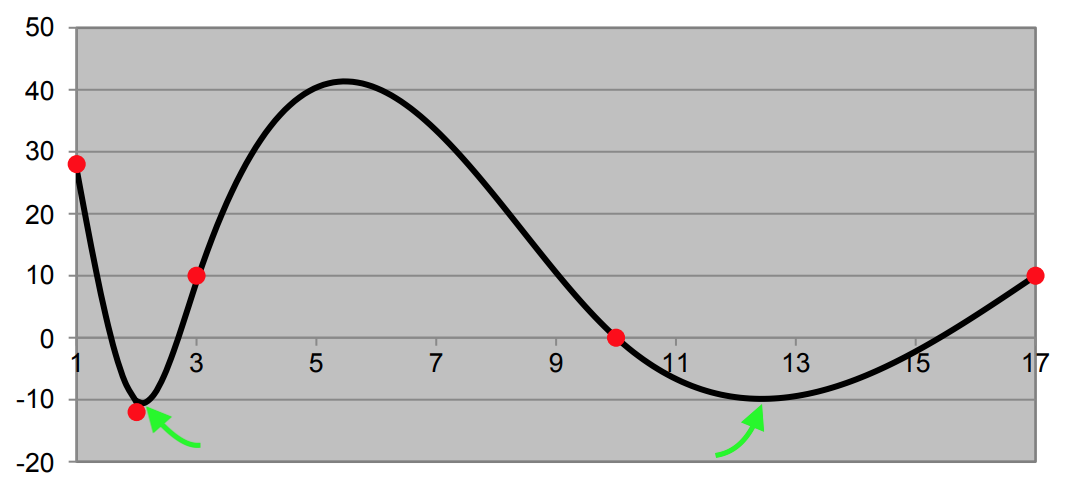
The following plot shows error function output based on system weights. Two equal local minima are shown in green pointers. Note that the red dots are not related to the question.

Considering the amount of convex in the local minima, is there any way to opt between these two local minima?

enter image description here

$\endgroup$

1 Answer 1

1
$\begingroup$

Just sharing my thoughts on this:

  • A local minimum in the loss function is just a synthetic measure expressing how well the model is performing on the target dataset (I'm assuming it's the test set)

  • Letting aside the absolute values, you could also consider the steepness of that region as follows:

    • the first LM is at the bottom of steep region which means the related parametrization is quite unstable as if you change it slightly the performance drop quickly (loss increases quickly) so you could interpret this as a parametrization with not great generalization capability (it is not robust against small changes): always remember that what you are actually looking for is model able to generalize well when in production (i.e. after you have deployed it so when training, validation, test is finished) and test set is typically a small proxy for the data observed in production (but it really depends on the final application itself)

    • the second LM is related to a much less steep region: even if you change the parametrization slightly you do not observe a big performance change which could be interpreted as a more stable parametrization hence with better possibility to generalize on unseen data

$\endgroup$
1
  • $\begingroup$ Comments are not for extended discussion; this conversation has been moved to chat. $\endgroup$
    – DukeZhou
    Commented Mar 2, 2019 at 21:39

You must log in to answer this question.

Not the answer you're looking for? Browse other questions tagged .