0
$\begingroup$

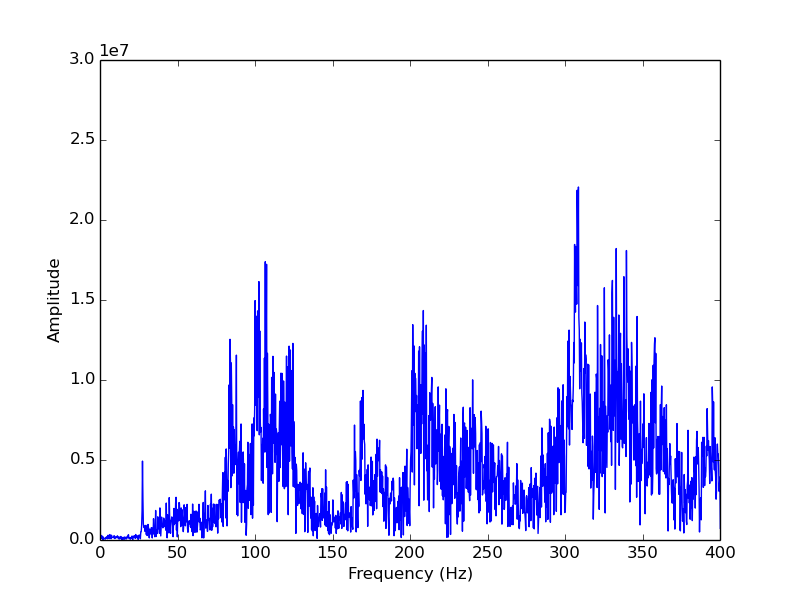
We want to try and distinguish real voices from (deep)fake voices using the graphs generated by a discrete fourier transform (generated from .wav audio files). We know from each image if it is a real or a fake voice, so it's a supervised classification problem. An image would look like this:

enter image description here

We think that real voices generate a graph with clear spikes, whereas fake voices have more noise resulting in less clear spikes. For this reason, we thought of using a CNN to take such an image as input (with x and y-axes ommited), and classify it as real or fake. Our concern is that it's actually a graph and not an image of an object, so we're not sure if this would be a good approach. We could also use the arrays generated from the fourier transform, but we're not sure how we could use that as input as we want to classify if it's real or fake, and not predict y for each x.

$\endgroup$
0

1 Answer 1

1
$\begingroup$

There no problem with the use of the data in form of an array to classify, whether the audio belongs to a real or fake voice. Just use 1d convolutional neural network with downsamplings or some global pooling operations, such that in the final layer the temporal extent of the signal has length 1. This would be the logit for binary classification.

However, as far as I understand, you get rid of phase after the Fourier transform, but it can be useful for the prediction. Probably, a better approach would be to use mel_spectrogram https://en.wikipedia.org/wiki/Mel-frequency_cepstrum for this problem.

$\endgroup$
2
  • $\begingroup$ Thanks! Wouldn't using a 1D CNN require time-series data? As you said, at this point we only have the frequencies vs. amplitude left. We're aware that using mel spectrograms could(possibly) perform better in such a CNN, but we were wondering if other methods could also work while making sense (so if it makes sense to use graph-like images for a CNN, or if there's some factor(s) as to why not) $\endgroup$ Commented Jun 9, 2021 at 11:12
  • $\begingroup$ A 1D CNN can be used, whenever you want to detect local patterns in one dimensional data. This can be used for time series but also in your example. 2D CNNs are used for images, and you basically have an image with one dimension, where the amplitude describes the pixel value. Therefore 1D CNN would be a good fit I think. You could also try working with recurrent cells (LSTM or GRU), but this will probably be much slower, and might not even work better. $\endgroup$
    – Evator
    Commented Mar 9, 2022 at 10:47

You must log in to answer this question.

Not the answer you're looking for? Browse other questions tagged .