1
$\begingroup$

Problem Summary: Identify which equation a set of data was most likely generated from

Problem Description: Let's say I have two different equations that are functions of variables X and Y and parameters A and B.

  • Class 1: $Z = f(X,Y,A,B)$
  • Class 2: $Z = g(X,Y,A,B)$

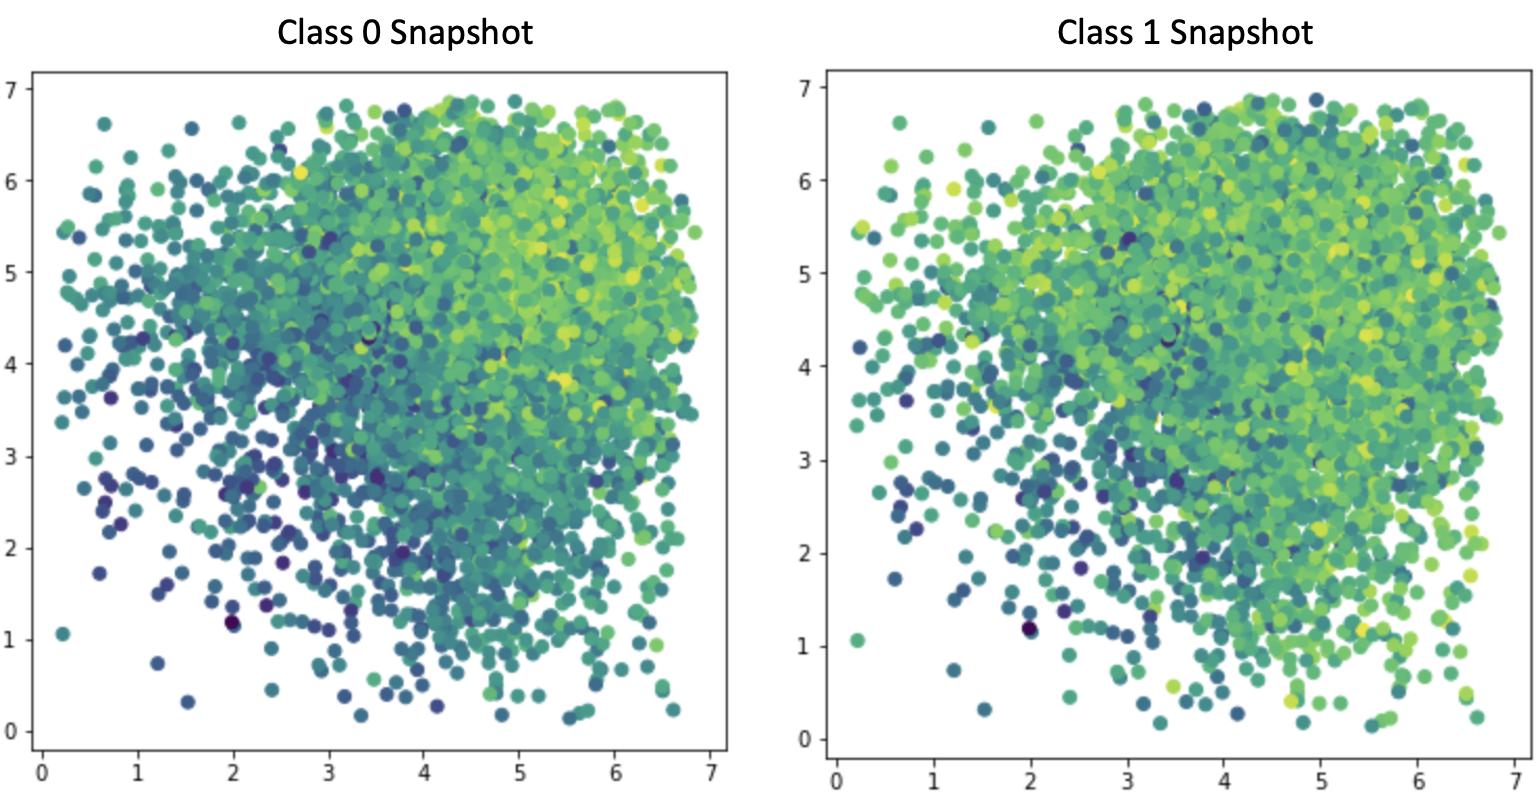
Now lets say I solve each equation 10k times using provided X and Y values, but randomized parameter values. This will generate two matrices with columns X, Y, and Z and 10k rows which I will now refer to as "snapshots". Below is an example of a visualization with the color representing the Z value.

NOTE: I'm not interested in just building a CNN to classifying the snapshot visualizations below because I hope to generalize this problem to equations with many more variables so they cant really be visualized easily.

enter image description here

My goal is to train a neural net using these snapshots (raw data, not visualizations) that are labeled with the equation that generated them.

However, I'm not really sure which type of neural net I should use. I could perhaps take a simple approach with a few fully-connected layers and the input would be the stretched out snapshot (so 30k long vector). Or maybe I need to use a CNN?

My primary concern is that unlike with an image, the features of these snapshots are kind of meaningless. For example, in a normal image each feature refers a specific pixel. But with these snapshots, each row is just a random simulation of the equation.


My Question:

Does anyone have a recommendation on which type of neural net to use for this problem? Perhaps recommendations on useful abstractions/transformations of the raw data I could use as features? Any online resources (github/kaggle notebooks, academic papers) that have investigated a similar question would be extremely helpful.


EDIT: Some additional thoughts. Perhaps I need to sort the snapshot based on the Z values so now the rows have meaning (largest output, 2nd largest output, etc).

$\endgroup$

2 Answers 2

2
$\begingroup$

Any neural network might be able to find some pattern (if there is one), provided adequate data. But you can always optimize with right assumptions.

For instance, there might not be always a relation between visual representation of the snapshot and the function family (many families can span similar space). So, using a CNN might not be a good idea. The data has no temporal relation, so RNNs are out as well.

An adequately large FNN and data will give you good results. You can later prune it and optimize.

$\endgroup$
1
$\begingroup$

according to the question you have 2 classes. the samples from the first class are generated according to f and the samples from the second class are generated according to function g which is different from f, i.e the points are simulated according to different dynamics.

Now we need to train a classifier to return the conditional probability of $P(Class|X,Y,Z,A,B)$.

depending on how non-linear this classification problem is, You can simply start with a simple fully connected network (lets say with 3 to 5 layers) and obviously the input layer has 5 node and hidden layers arbitrary size (shown with h_i) and the output layer should have two nodes (because you want to assign a score to 2 classes).

here is the number and size of the layers
Layers: [5,h_1,h_2,...,h_last,2]
Then you can train your network with CrossEntropy loss (https://medium.com/swlh/cross-entropy-loss-in-pytorch-c010faf97bab)

Once you got the first result, I would play with the the number of hidden layers (m) and size of each layer (h_i). If still the result is not good enough then you can think of more complex models such transformers -the backbone of large language models- (https://arxiv.org/pdf/1706.03762) which is more powerfull.

I hope I gave you some ideas how to proceed.

$\endgroup$

You must log in to answer this question.

Not the answer you're looking for? Browse other questions tagged .