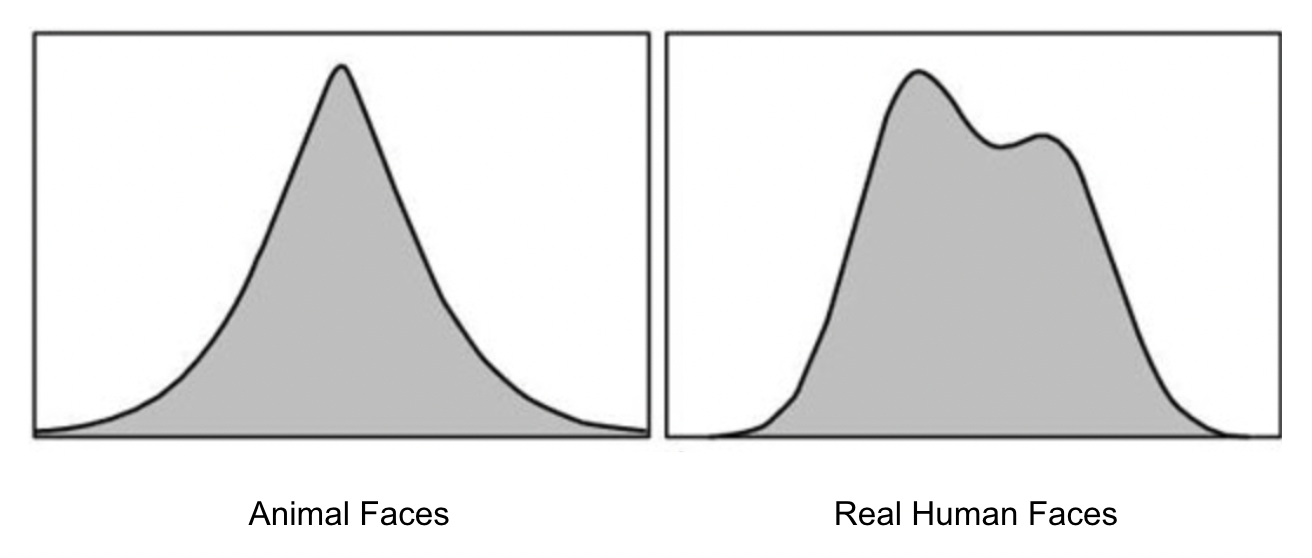
The main reason of using the term data distribution over the random variable is to note for the intrinsic relationship the different data samples have with each other.
It is a mathematical way of saying this data is almost random (consider the average pixel on a human face dataset) but it has some underlaying relationship (the concept of human faces).
This is also helpful to describe that different images can be similar looking but represent different underlaying concepts. For example: consider 2 dataset: human faces, $x_{human}$, and animal faces, $x_{animal}$. Although most of the images might look similar at a pixel level: similar colors, similar textures, similar backgrounds... The underlaying concept depicted in itthem differs: human faces vs animal faces. How
So, how do you represent that mathematically?: with two overlapping distributions of different shape.
This basically mean: "even though the images might seem random, might overlap in some domains (color, textures, histogram...) there is an intrinsic difference between the two" and this difference (the shape of the distribution) is the target intrinsic concept that the neural network will have to learn.
In the specific case of GANs the left distribution would be the "Generated Faces" and this distribution will try to fit the right distribution that would be "Real Faces".

