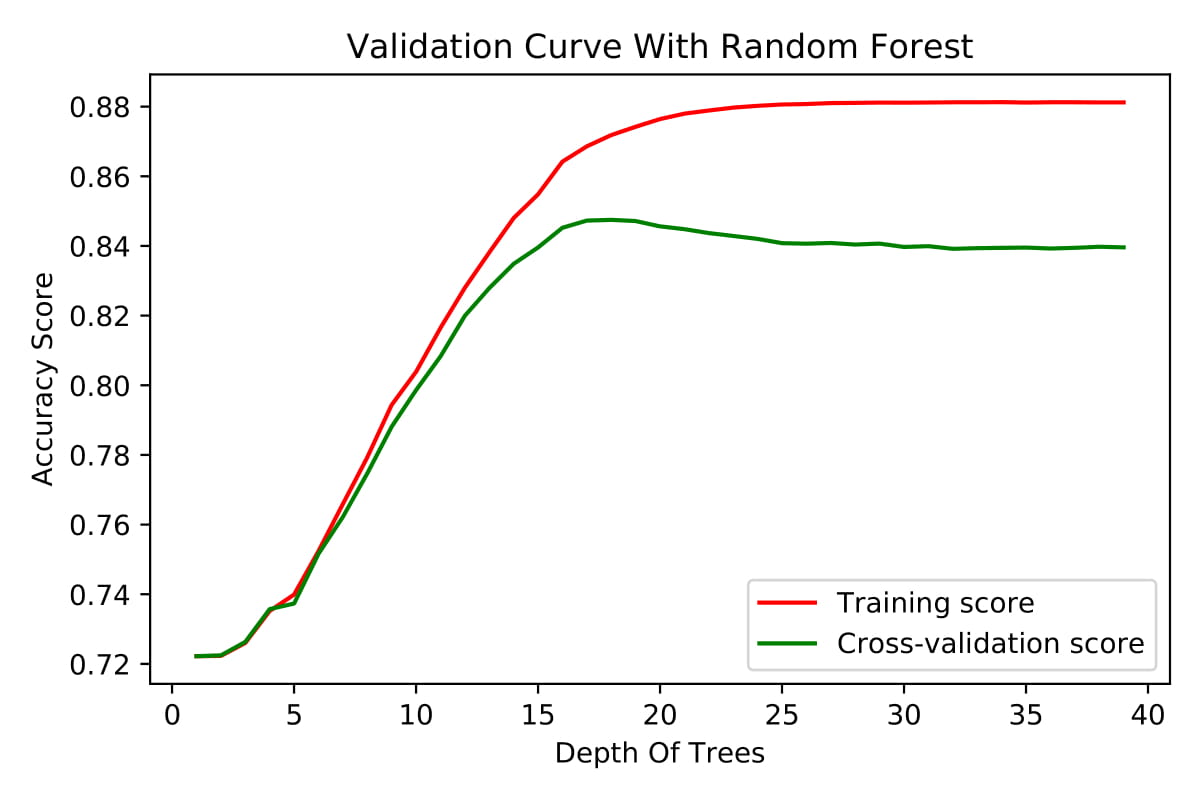
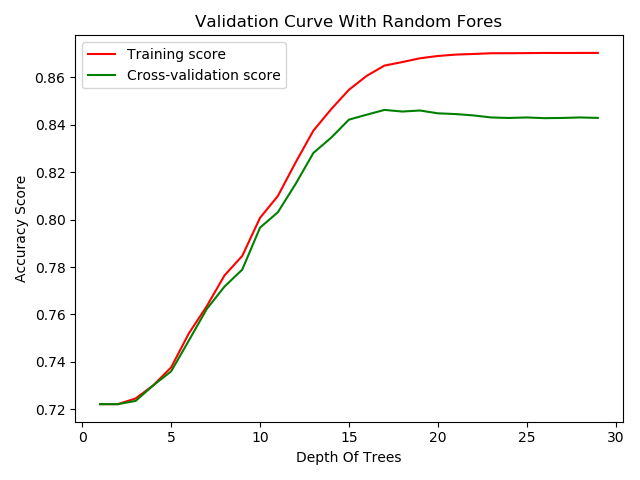
Bellow I have a validation plot How should I interpret this validation plot? Is my data underfitting? What else can be seen from this? Which one is the best?
What does it mean that the right line is growing and green line decrease (slightly) for example after 15?


