0
$\begingroup$

I'm employing the Actor-Critic algorithm. The critic network approximates the action-value function, i.e. $Q(s, a)$, which determines how good a particular state is, when provided with an action.

$Q(s, a)$ is approximated using the backpropagation of the temporal difference error (TD error). We can understand that $Q(s, a)$ has been approximated properly when TD error is minimized, i.e. when it is saturated at lower values.

My question is, when exactly can you say that $Q(s, a)$ is approximated properly, if you don't have TD error, i.e. if you have to plot the graph between $Q(s, a)$ vs episodes, then what would be the optimal behaviour?

Will it be increasing exponential with saturation value around reward values, or increasing exponential with saturation (around any value)?

Follow up: What can be the possible mistake, if the output of Q-value function is around 5x the rewards, and not saturating?

$\endgroup$
8
  • $\begingroup$ Which actor-critic algorithm have you implemented exactly? From which paper or book? I suppose you're using a neural network to approximate $Q(s, a)$, given your description. Moreover, when you say "if you have to plot the graph between Q(s, a) vs episodes", what graph are you exactly talking about? Can you show an example of such a graph that you have plotted? Also, why don't you have the TD error? $\endgroup$
    – nbro
    Commented Jan 25, 2021 at 12:46
  • $\begingroup$ I'm using the standard actor critic, where critic network is optimized using TD Error. I wanted to plot the values of $Q(s, a)$ (my network has 1 output neuron) vs training episodes, to know what are the possible values around which $Q(s, a)$ get saturated. However, my question is answered by little more experimentation and research. I'll be adding the answer soon. $\endgroup$ Commented Jan 25, 2021 at 16:06
  • $\begingroup$ So, are you using function approximation or not? In any case, I would suggest that you put the title in the form of a question, your specific question. Right now, the title is not very clear. Also, what you wanted to plot, according to your answer, was the mean Q(s, a) value, but that alone doesn't mean much. The Q-value is a function of the state and action, so if you average the Q-values across all states and actions, that's probably meaningless. $\endgroup$
    – nbro
    Commented Jan 25, 2021 at 18:51
  • $\begingroup$ Yes, I'm using function approximation. I'll take care of the title as well. @nbro, can elaborate on why averaging Q-values across all the states and actions is probably meaningless? My state is basically the channel coefficient H, and action is the amount of power transmitted in that H. $\endgroup$ Commented Jan 25, 2021 at 19:03
  • $\begingroup$ Because, for example, in one state $s_1$, the average value across all possible actions in that state may be 1, while the average value across all actions in state $s_2$ may be 1000. However, maybe, in both cases, the relative value of the actions in the specific state is the same, i.e. the optimal action is the same, the second best optimal action is also the same and so on. Of course, the values of the states depend on 1. how you initialize the Q-network, 2. how you explore the environment, 3. the learning update. $\endgroup$
    – nbro
    Commented Jan 25, 2021 at 19:08

1 Answer 1

1
$\begingroup$

TLDR;

The output of Q-value function will eventually saturate. Can't say when, but it will surely do.

Detailed Answer

if you don't have TD error

It meant, if I don't have logs of the error.

$Q(s, a)$ vs Episodes Graph

To understand, how $Q(s, a)$ behaves as the episodes increase.

I was under a wrong impression that, the $Q(s, a)$ will saturate around the values given by the reward function.

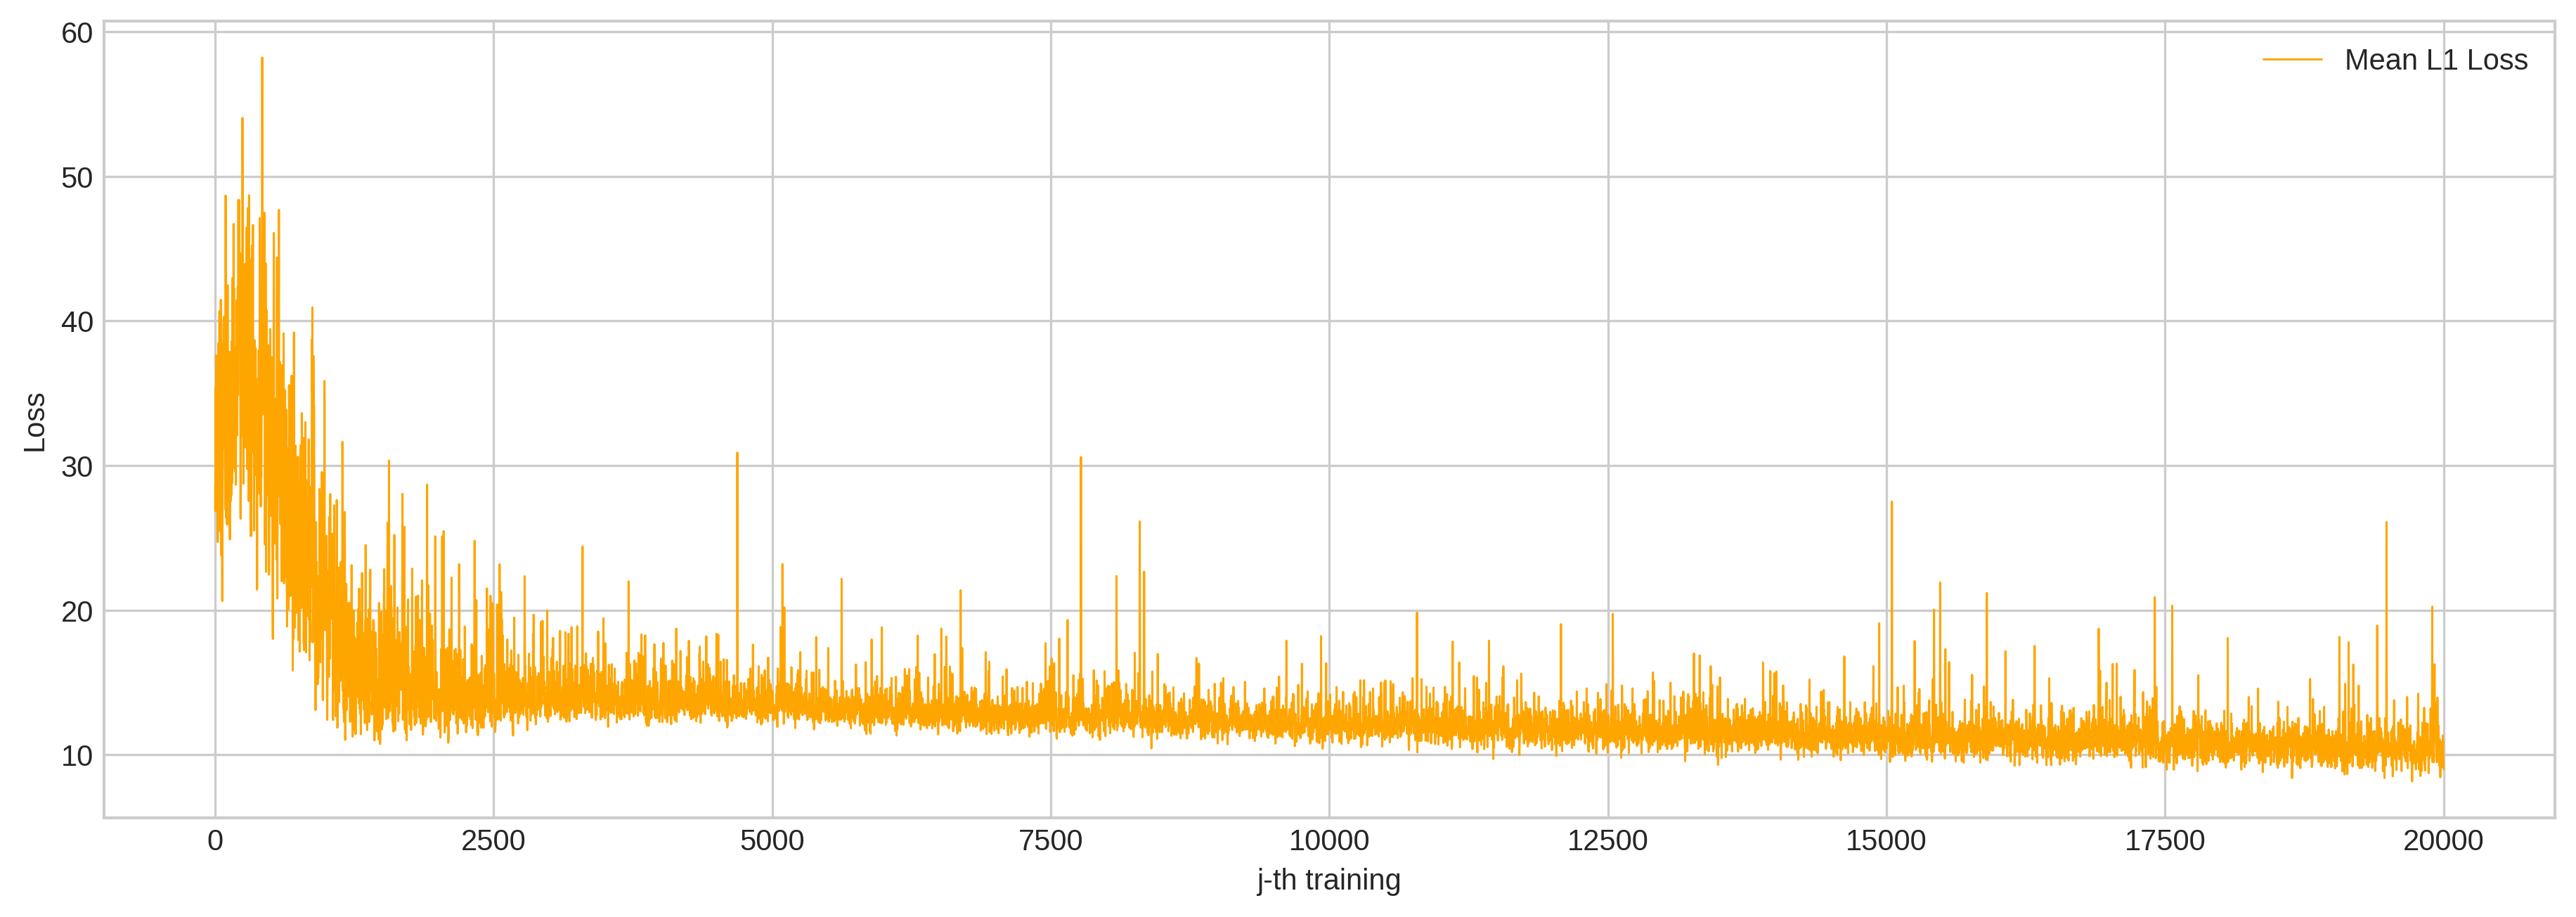
As evident from Loss vs Training Episodes Curve, we can see that loss (TD Error) is almost saturated. enter image description here

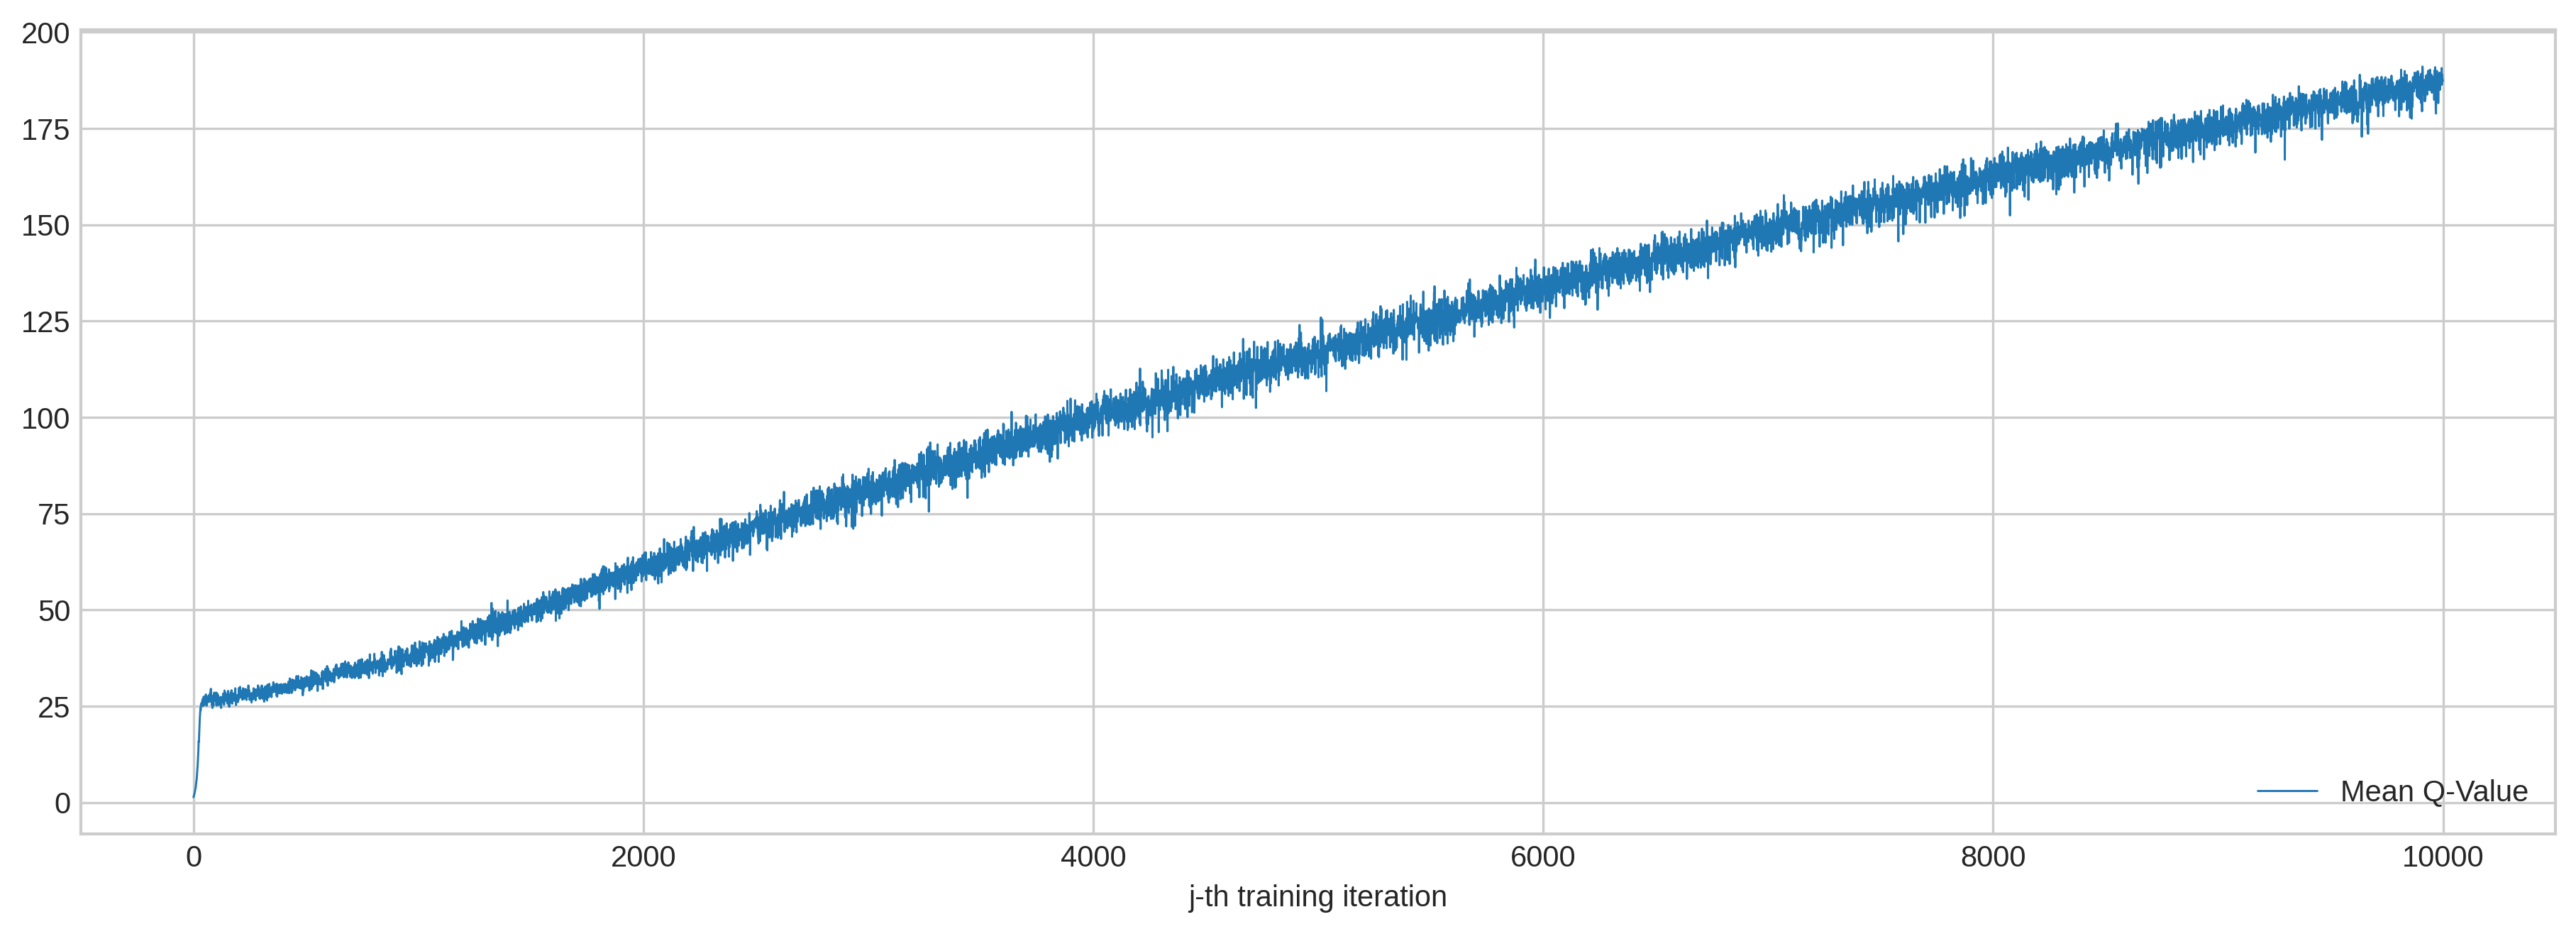
However, $Q(s, a)$ vs training episodes curve is not saturated yet. enter image description here

The only explanation for the above two graphs could be given as follows: The target estimate ($r + \gamma Q(s', a')$) and $Q(s, a)$ are almost similar due to which, the error is quite low. But, $Q(s, a)$ is still nowhere near optimal value $Q^{*}(s, a)$.

Hence, I gave it another shot and made it run for twice training episodes i.e. 20000, and below are the results.

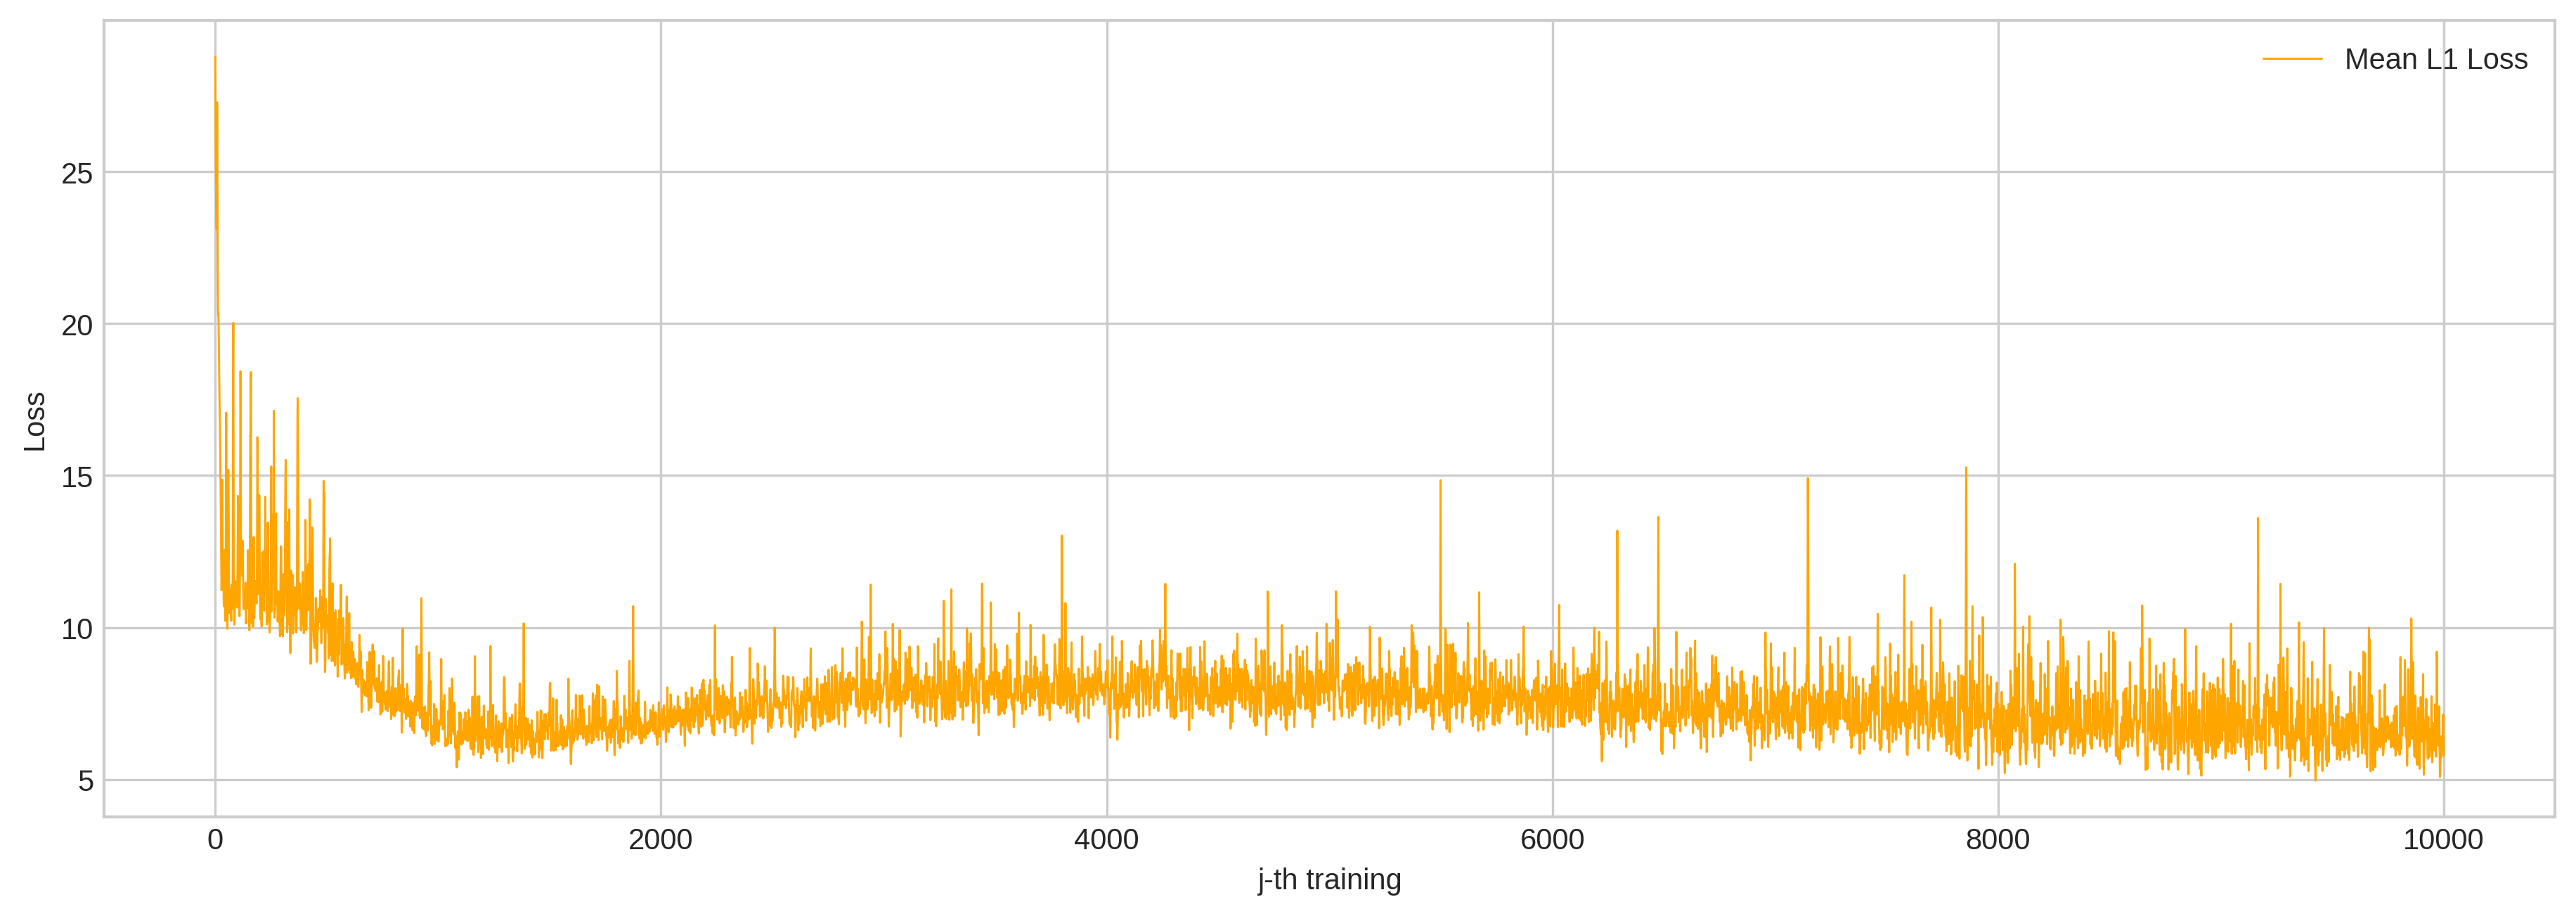
A nearly saturated loss enter image description here

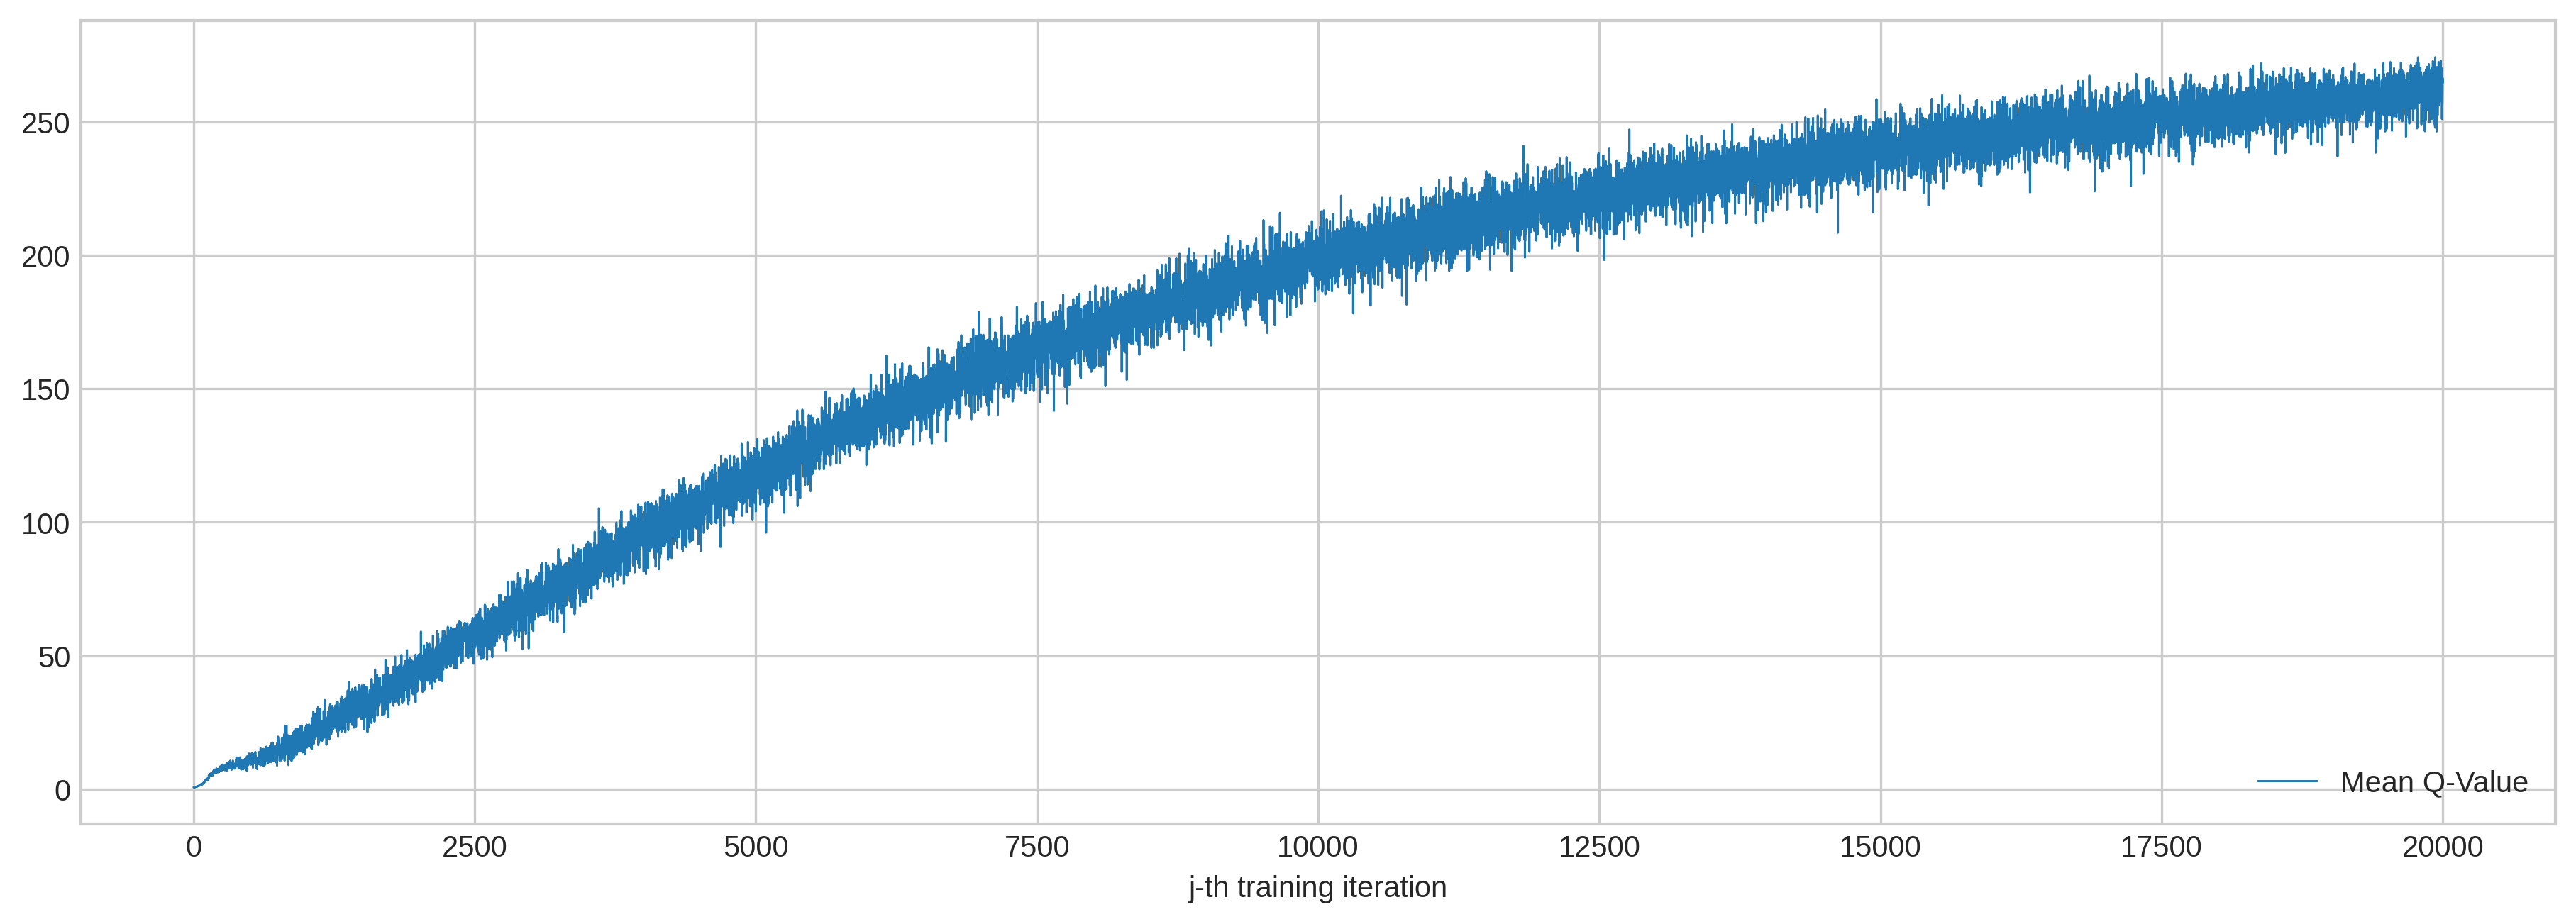
and a nearly saturating $Q(s, a)$. enter image description here.

Note that, the value of $Q(s, a)$ saturating is around 250 - 300 (will run it for more iterations) and it is nowhere around the reward values $ \in [-100, 35]$.

Hence, the $Q(s, a)$ vs episodes will saturate.

$\endgroup$

You must log in to answer this question.

Not the answer you're looking for? Browse other questions tagged .