1
$\begingroup$

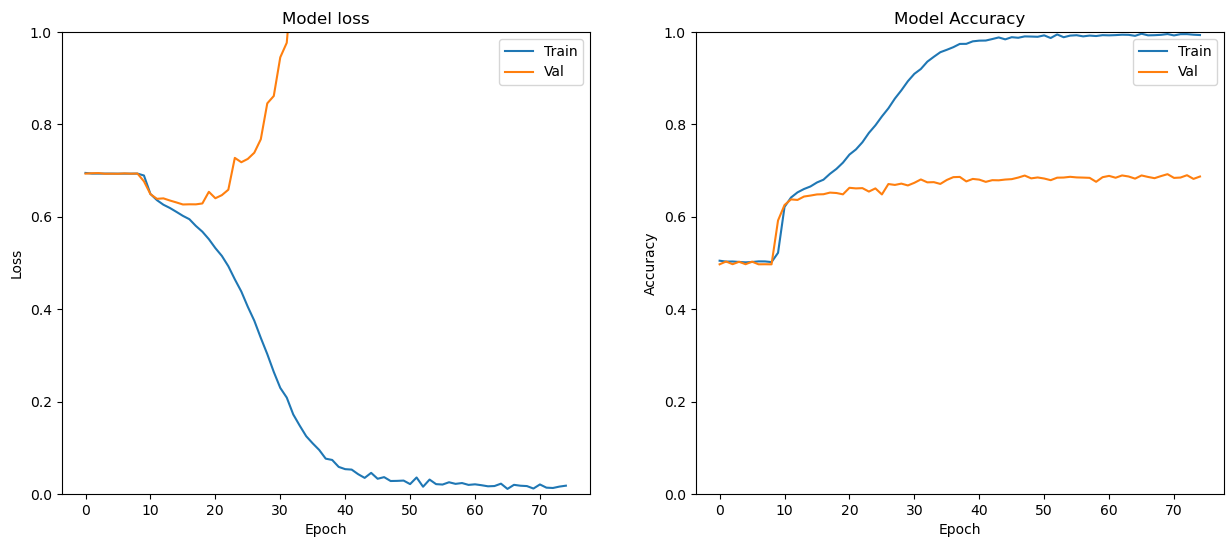
How to interpret the following learning curves?

Background: The accuracy starts at 50%, because the network has a binary output (0 or 1). I chose an exponentially decreasing learning rate of the optimizer - I believe that this the reason why the network starts learning after 10 epochs or so.

lr_schedule = keras.optimizers.schedules.ExponentialDecay(**h_p["optimizer"]["adam"])
optimizer = keras.optimizers.Adam(learning_rate=lr_schedule)
h_p["Compile"]["optimizer"] = optimizer

enter image description here

$\endgroup$
1
  • $\begingroup$ This is a textbook case of overfitting. Your network fits particular patterns existing only on the training data, and fails to generalize. Given your training curves, you should stop training at about 20th epoch, in which the validation loss is the lowest. $\endgroup$
    – SpiderRico
    Commented Apr 7, 2021 at 17:13

1 Answer 1

1
$\begingroup$

It looks like your network is overfitting, because the training loss carries on decreasing to zero even though validation loss levels off, and then starts to increase again.

I would guess that your network is essentially "memorising" the training examples because you're getting a near zero loss in training.

You could try:

  • applying some form of regularisation
  • reducing the number of neurons or layers
  • collecting more training data to see if that helps.

Ideally you want to minimise validation loss, so epoch 20 was about the best point in your graph. Look into early stopping: this is an effective way to avoid overfitting too much.

When the learning rate is too high, you often see the loss 'jumping around' quite rapidly, and when the learning rate is too low, the graph barely changes at all. You could try fixing the learning rate closer to what it is around epoch 10 and see if this is "the sweet spot"; it's mostly a game of experimenting to see which works best.

$\endgroup$

You must log in to answer this question.

Not the answer you're looking for? Browse other questions tagged .