When we are training a neural network, we are going to determine the embedding size to convert the categorical (in NLP, for instance) or continuous (in computer vision or voice) information to hidden vectors (or embeddings), but I wonder if there are some rules to set the size of it?
3 Answers
In most cases, seems that embedding dim is chosen empirically, by trial and error.
Older papers in NLP used 300 conventionally https://petuum.medium.com/embeddings-a-matrix-of-meaning-4de877c9aa27. More recent papers used 512, 768, 1024.
One of the factors, influencing the choice of embedding is the way you would like different vectors to correlate with each other. In high dimensional space with probability 1, chosen at random vectors would be approximately mutually orthogonal. Whereas in the low dimensions and case of many different classes, many vectors will have dot product, significantly different from 0.
I think, that if one expects, that many vectors have to be correlated then the dimension shouldn't be very high. And otherwise, if each of the possible keys in the embedding is expected to produce a different, unrelated vector, than dimensionality is expected to be large.
There is a rule of thumb that says min(50, num_categories/2). But this tops out at 100 categories, what to do after that? I propose this:
When num_categories <= 1000:
num_embeddings = min(500, num_categories/2)
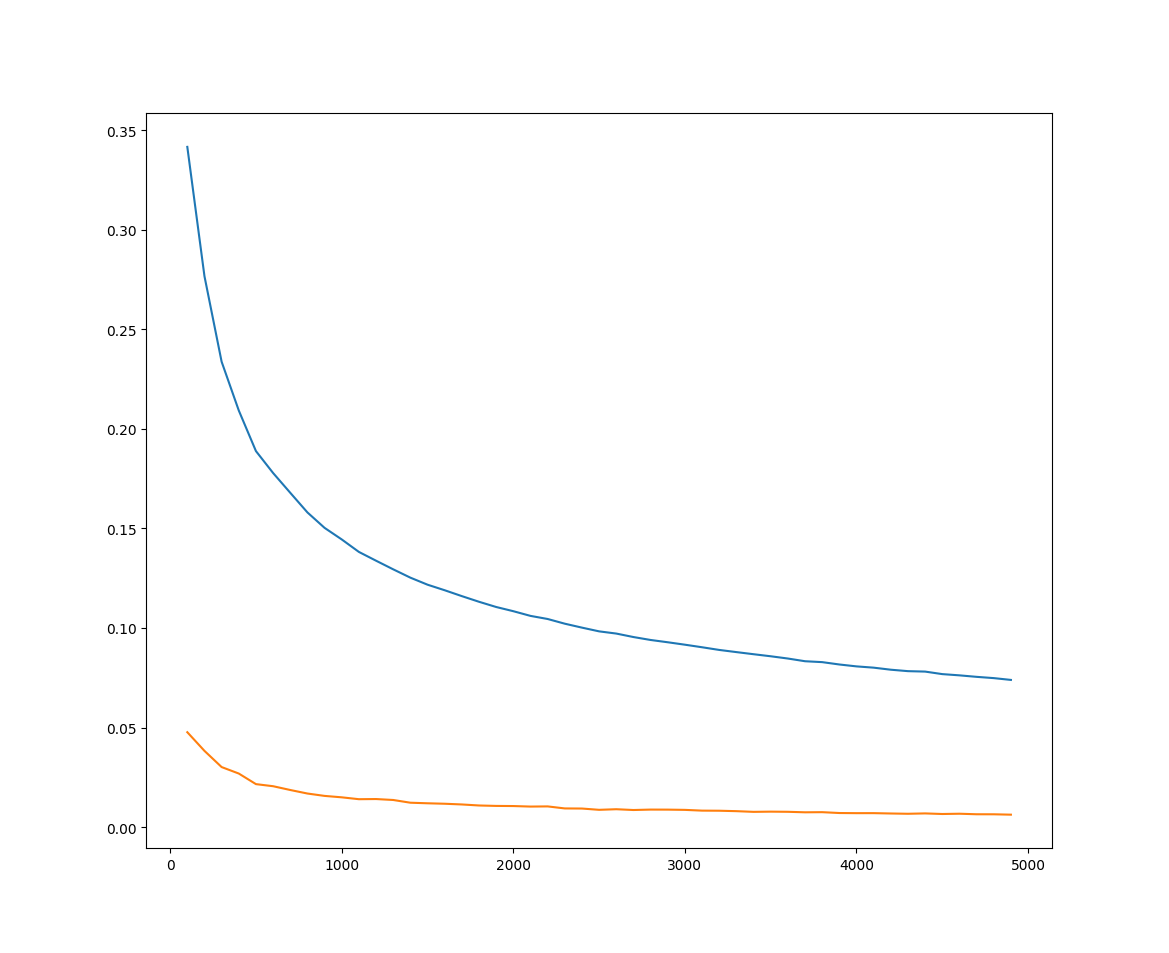
Why? Going off of Spiridon's answer, we want to see how orthogonal a randomly distributed set of N vectors are in a given dimension D. One way to do this is to check every vector and take its dot-product with every other vector to see which it is the most similar to. We can normalize the vectors so that the dot product always lands between -1 and 1. Do this for every vector and you will have a list we can now take the average of and standard deviation, which I have graphed below. The x-axis is the num_categories, y-axis is average(blue) and std(red) of max dot-products. We set num_embeddings equal to num_categories/2.
We can see that at around 1000 dimensions, the change in both become fairly flat and there isn't much to gain by adding more. From here, we can start to slow down the rate your num_embeddings grow with the following formula:
When num_categories > 1000:
num_embeddings = 75.6496 * ln(num_categories + 176.623) - 41.4457
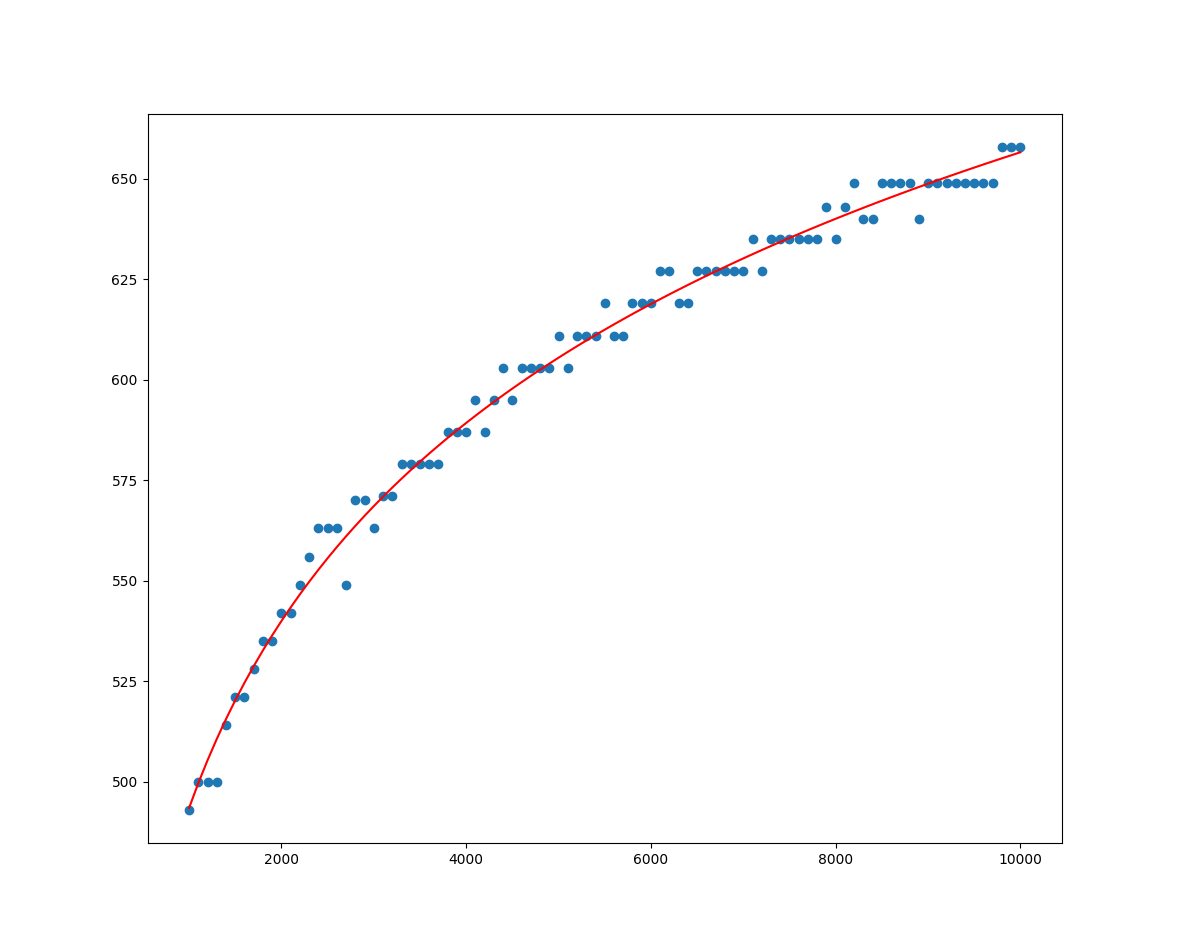
Plugging in 1000 into this formula will give roughly 500, so it's a smooth transition from the rule of thumb above. But this formula extends well beyond 1000, for example in GPT2 the number of categories was 50257, if we plug this number into the formula we get 778, which is very close to the default number of embeddings that GPT2 actually used: 768. The reason for this is because this formula is derived from trying to find num_embeddings for different num_categories that would have a similar average and std as GPT2 had with 50257 & 768. The datapoints below define the curve, but as you can see it extrapolates well beyond the final point in the dataset at 10,000:
Here x-axis is num_categories, and the y-axis is the num_embeddings found to achieve a combined avg+std of the same as GPT2's settings.
I get an answer from this book: Machine Learning Design Patterns: Solutions to Common Challenges in Data Preparation, Model Building, and MLOps.
If we’re in a hurry, one rule of thumb is to use the fourth root of the total number of unique categorical elements while another is that the embedding dimension should be approximately 1.6 times the square root of the number of unique elements in the category, and no less than 600.

