2
$\begingroup$

We are making a classification model that takes a clip of a movie as an input and predicts who the director is. Roughly speaking, it will be a model that understands film directors' unique style.

We are going to extract 5 features from a movie: a visual-feature vector from ResNet pretrained on ImageNet, an audio-feature vector from an audio model, shot type of a frame (one-hot encoding), emotion detection, and a color scheme of a frame. In the end, we are going to concatenate all these feature vectors and give it as a input for our classification model.

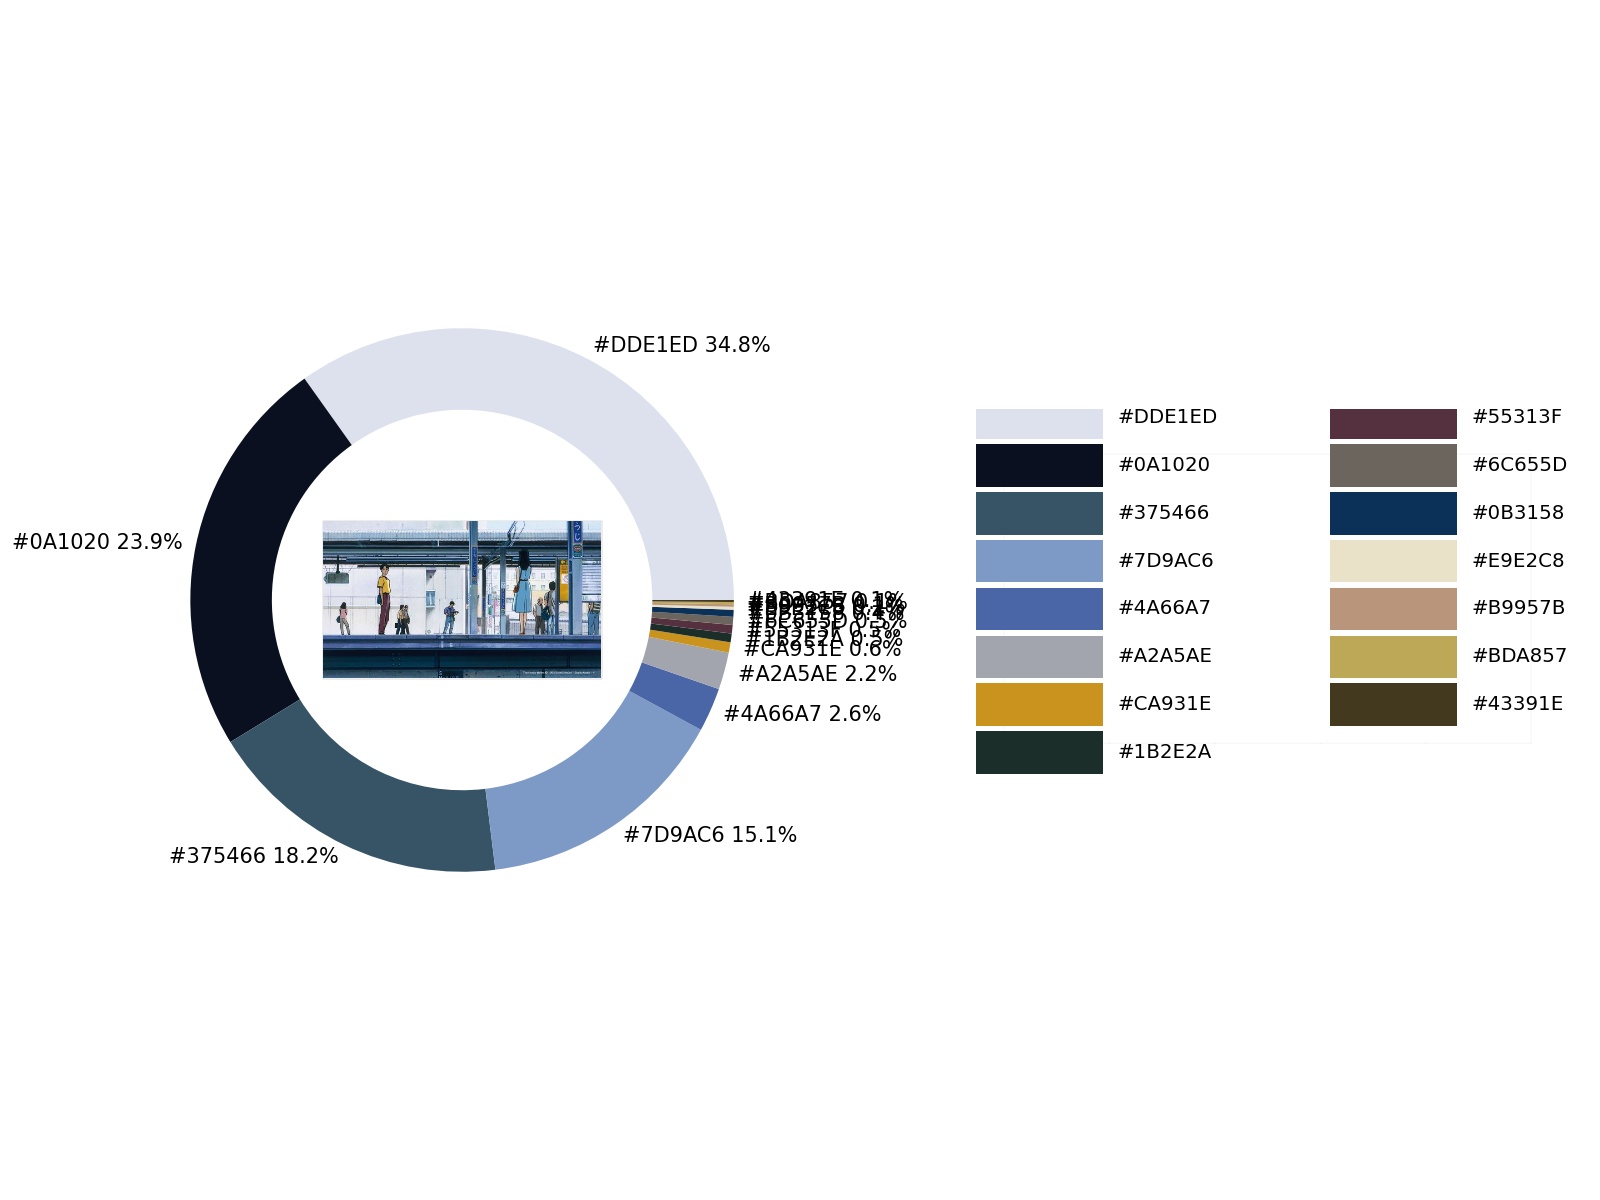
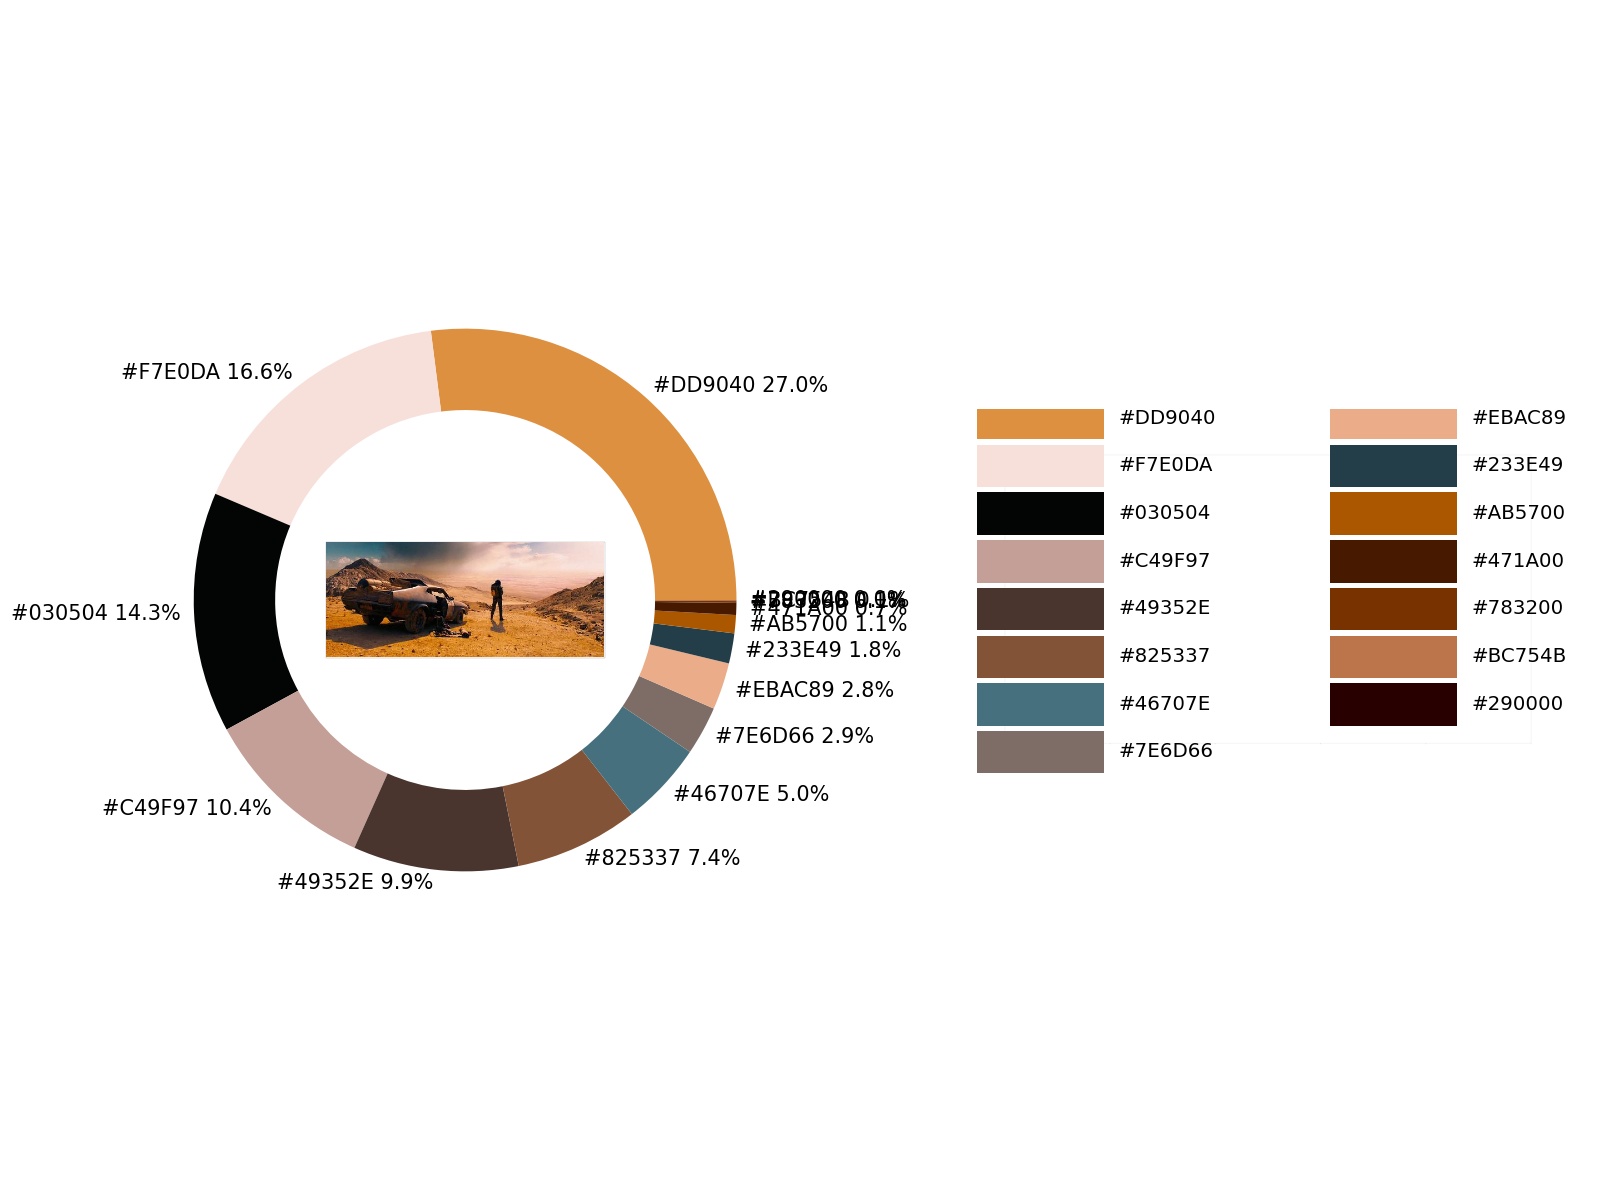
We find a tool that can extract color scheme(or palette) of an image as below. It both has information about colors and their proportion. However, I can't think a smart way to convert this information into 1-d vector form. Any ideas?

Of course I know the ResNet will get information about colors but the importance of color will be degraded in ResNet. I think the color is very important feature in defining a director's style and thus I want to use a color feature separately.

enter image description here enter image description here

$\endgroup$

2 Answers 2

4
$\begingroup$

My 2 suggestions would be to:

  1. Sum the hex coding of the color multiplied by the prevalence. For example [80, 80, 80] (grey) is used 7% of the time so color_features += [80, 80, 80] * 0.07.
  2. You determine a preset number of color bins (maximally distinct colors used as protoypes for the bins). Bin the colors based on distance, and add the prevalence of all colors in that bin together to a float value.

Example of option 2:

# colors is a list of (color, prevalence) tuples.
colors = [(DDDDDD, 0.30), (EEEEEE, 0.40), (111111, 0.10), (222222, 0.20)]
prototypes = [FFFFFF, 000000] # White and black
# colors[0] and colors[1] are close to white
# colors[2] and colors[3] are close to black
# For each prototype we add the prevalences together that go with that prototype
features = [0.70, 0,30]

The first option is probably too reductionist, while the second may be too generalized or too complex depending on the number of bins being too low or too high, respectively.

Both options are based on intuition from experience, rather than any literature or empirical evidence.

$\endgroup$
2
  • $\begingroup$ Would you please elaborate more about the second option? You mean using color histogram with appropriate bin size (e.g. 16/32/64)? Or do you mean picking up appropriate number of colors (like the right side of above images) and concatenate with its prevalence? For example, [ 80,80,80, 0.3, 255,0,0, 0.5, 0,0,255,0.2] which means grey(80,80,80) is used 30% and red(255,0,0) is used 50% and blue(0,0,255) is used 20%. $\endgroup$ Commented May 31, 2022 at 10:09
  • $\begingroup$ I mean you determine a preset number of color bins (maximally distinct colors used as protoypes for the bins). The simplest example would be to do white (FFFFFF) and black (000000) and you do a distance calculation of each color in that analysis tool of which bin prototype its closest to and assign it to that. Then you add the prevalence of the binned colors together into a float value for that bin. I'll add an example to my answer. $\endgroup$
    – Kroshtan
    Commented May 31, 2022 at 13:42
3
$\begingroup$

I think the tool you found is useful for a human and to get nice visuals but I also think it's totally useless for feature extraction.

If you want to pass explicit information about colors simply concatenate 3 normalized histograms for each color channel. You're guarantee to have always a fixed sized color feature vector (n_bins * 3) and you can't literally pass more information about colors, the histograms contain even more information than a compressed color palette.

$\endgroup$

You must log in to answer this question.

Not the answer you're looking for? Browse other questions tagged .