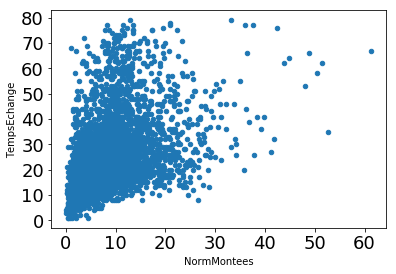
I have a data set that looks like this:
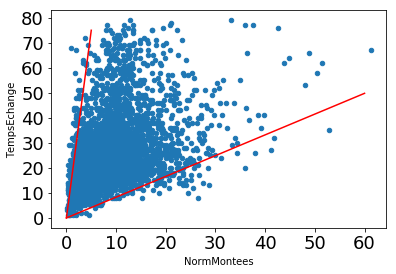
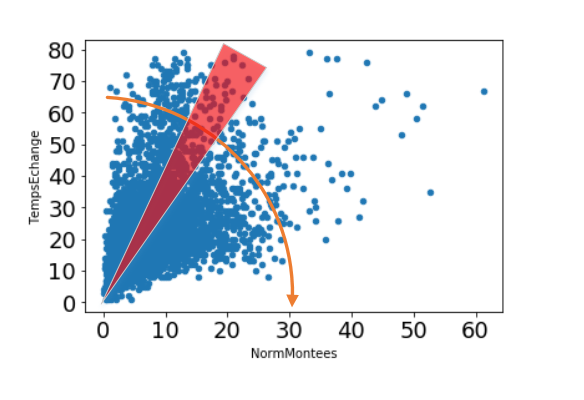
I would like to estimate a relationship between x-values and the corresponding 5% extreme y-values, something that might look like that :
Do you have an idea of an algorithm that might help me for this ? I thought about labelling the extreme values for later finding a separating hyperplane, but I have no clue on how to label these "extreme values" (I cannot just take the 5% lowest and highest values as all these would end up in the same region).
Thanks for your ideas !


